

Cycle time per operation
Service 06 · Lean analysis
Data-driven analysis. Measurable results.
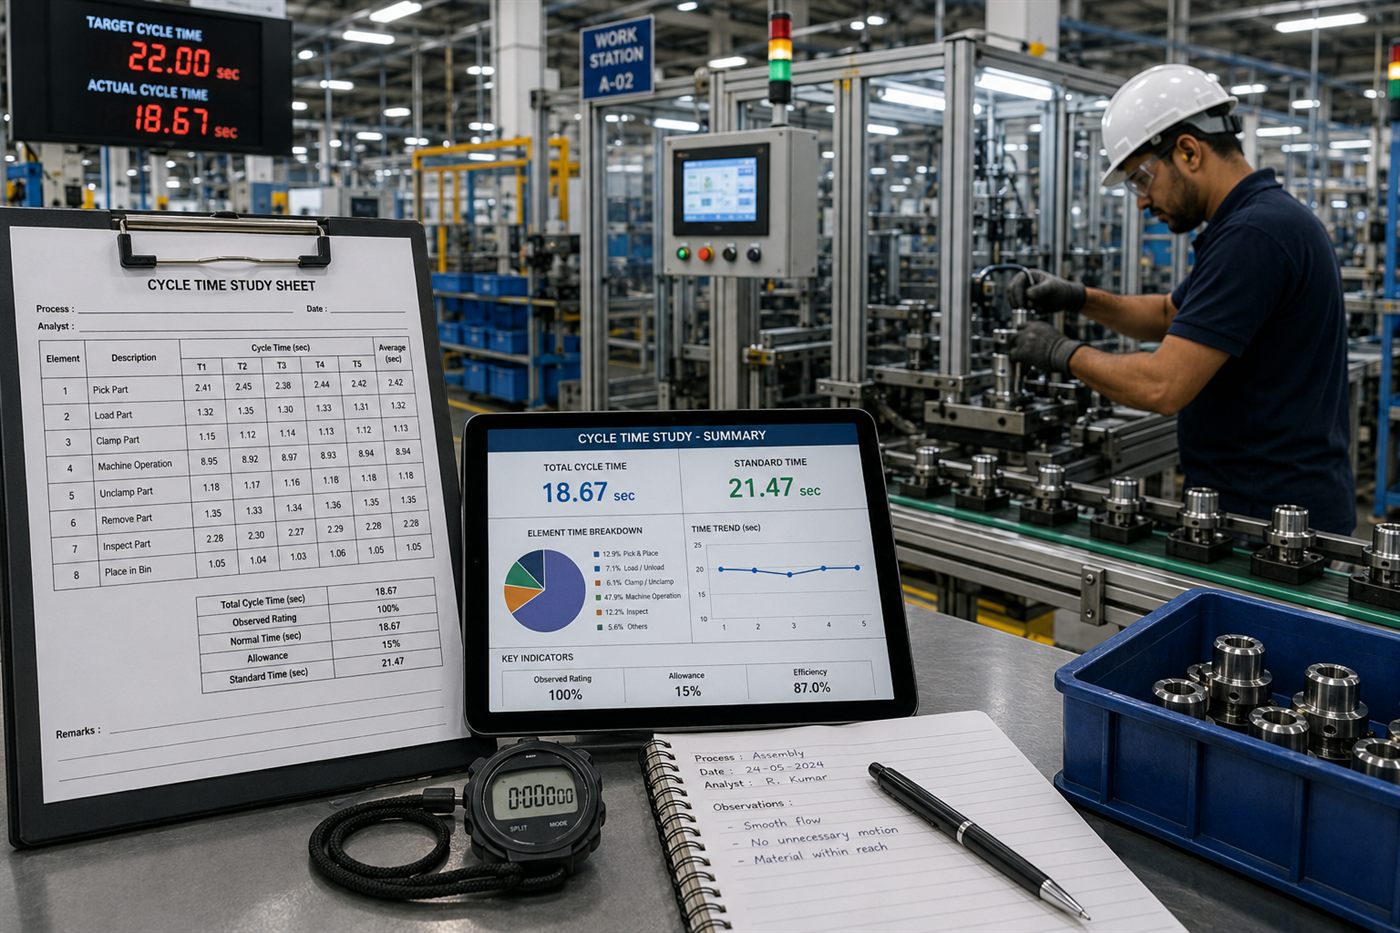
We provide comprehensive Cycle Time, Lead Time and Takt Time analysis based on lean manufacturing methodology — quantifying inefficiencies across your production line before anyone proposes spending money on it.
The problem
Most improvement budgets are spent on the wrong station.
Without measured data, the station that feels slow gets the investment — and the line output does not change, because the real constraint was three operations upstream.
A cycle time study replaces opinion with numbers: what each operation actually takes, where the waiting happens, and what the line could do if the constraint were removed.
The rule we apply: instrument, measure, then automate. Automating an unmeasured process usually produces a faster version of the same waste.
We measure
We measure
Lead time end to end
We measure
Takt time vs. demand
We measure
Non-value-added activity
Our method
Industry-standard measurement, applied properly.
01
Time-motion study
Direct observation of each operation across multiple cycles and operators, separating repeatable work content from variation.
02
Process flow mapping
Mapping material and information flow through the line, including buffers, transport and inspection steps that rarely appear in the routing.
03
Bottleneck identification
Determining which operation genuinely constrains output — and how much of its cycle is value-added versus waiting, handling or rework.
04
Benchmarking against takt
Comparing current performance to optimal takt time derived from actual demand, so the target is grounded rather than aspirational.
05
Throughput gain calculation
Quantifying the potential output improvement from each intervention, so the investment case can be ranked by return.
06
Optimization recommendations
Root-cause analysis of delays with concrete recommendations — including PLC-based automation solutions where applicable.
Deliverables
What you receive at the end.
A study you can act on, present internally and use to justify capital — not a slide deck of generic lean principles.
- Detailed process data for every observed operation
- Root-cause analysis of delays and stoppages
- Value-added vs. non-value-added activity breakdown
- Current performance benchmarked against optimal takt time
- Calculated potential throughput gains per intervention
- Prioritised optimization recommendations
- Implementation support through PLC-based automation where applicable
Benefits
Why start here.
Investment targeted correctly
Money goes to the operation that actually constrains output, not the one that looks busiest.
A defensible business case
Quantified throughput gains make internal approval far easier to obtain.
Automation scoped correctly
The cell gets designed around a real takt requirement rather than an assumed one.
Gains without capital
Many recommendations are sequencing or layout changes that cost nothing to implement.
Related
Natural next steps
Platform
MAPP EYE
Make the measurement continuous instead of a one-off study — automated OEE with time-stamped loss analysis.
Service 03Turnkey automation
Where the recommendation is a new cell, we design and build it to the takt the study established.
Service 07Retrofitting & re-tooling
Where existing equipment can hit the target with modernisation instead of replacement.
Looking for something else?
Get in touch
Find out what your line can really do.
A short study usually pays for itself before any capital is committed.